e-conomics
  • Home
  • 12HL Economics
  • 11SL Economics
  • Admin
  • Foundations
    • Videos - Scarcity, Choice and the PPC
    • Production possibility curves
    • A monkey economy as irrational as ours
    • Jason Welker - The Economics Classroom... a series of worksheets and practice activities
  • 2016-18
  • Microeconomics
    • 1.1 Competitive markets: demand and supply >
      • Markets
      • Supply and demand >
        • Linear demand and supply functions
        • Practice question: linear demand and supply
      • Market equilibrium >
        • Food, glorious food - but what a price
        • Tomatoes hit outrageous price
      • More videos on demand, supply, equilibrium
    • 1.2 Elasticities >
      • Elasticity formulae and practice
      • Case studies
      • Meet the credit crunch winners
    • 1.3 Government intervention >
      • Practice question: indirect taxes
      • Practice question: subsidies
      • Minimum price - coffee
    • 1.4 Market failure >
      • The tragedy of the bunnies
    • 1.5 Theory of the firm (HL only) >
      • Videos
      • Cost curve practice
      • Probe into chocolate 'price-fixing'
  • Macroeconomics
    • 2.1 The level of overall economic activity >
      • What is GDP and why does it matter?
      • Green GDP
    • 2.2 Aggregate demand and aggregate supply >
      • Supply side bottlenecks
    • 2.3 Macroeconomic objectives >
      • Low unemployment >
        • How technology wrecks the middle class
      • Low and stable rate of inflation
      • Economic growth
      • Equity in the distribution of income
    • 2.4 Fiscal policy
    • 2.5 Monetary policy
    • 2.6 Supply-side policy
  • International
    • 3.1 International trade
    • 3.2 Exchange rates
    • 3.3 The balance of payments
    • 3.4 Economic integration
    • 3.5 Terms of trade (HL only)
  • Development economics
    • 4.1 Economic development >
      • Introduction to development (Tutor2U)
      • Millennium Development Goals
      • MDG Progress Reports
    • 4.2 Measuring development
    • 4.3 The role of domestic factors
    • 4.4 The role of international trade
    • 4.5 The role of foreign direct investment (FDI)
    • 4.6 The role of foreign aid and multilateral development assistance
    • 4.7 The role of international debt
    • 4.8 The balance between markets and intervention
  • Visible Thinking
  • Untitled

SL Economics

Announcements, what we did or what we will do, homework and other stuff

Link to Veracross

2.2 Aggregate demand and aggregate supply (3) - equilibrium

3/25/2016

0 Comments

 
Picture
Short-run equilibrium
  • Explain, using a diagram, the determination of short-run equilibrium, using the SRAS curve.
  • Examine, using diagrams, the impacts of changes in short-run equilibrium.​

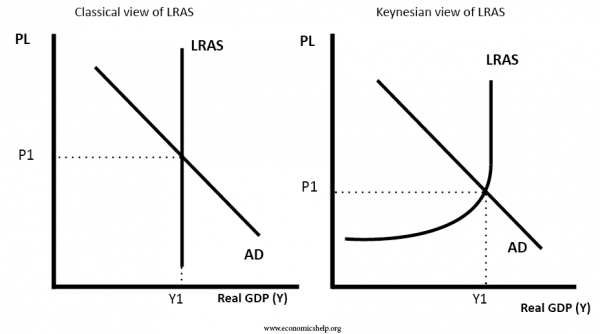
Task:  Short run equilibrium occurs where AD=SRAS, this may or may not coincide with the full employment level of equilibrium.  If AD or SRAS change then so will the price level and the level of real income/output/GDP.  You will be given a handout to show short run equilibrium and some tasks in which you will analyse the impact of various scenarios on the economy using AD/SRAS analysis.  

Equilibrium in the monetarist/new classical model
  • Explain, using a diagram, the determination of long-run equilibrium, indicating that long-run equilibrium occurs at the full employment level of output.
  • Explain why, in the monetarist/new classical approach, while there may be short-term fluctuations in output, the economy will always return to the full employment level of output in the long run.
  • Examine, using diagrams, the impacts of changes in the long-run equilibrium.
Equilibrium in the Keynesian model
  • Explain, using the Keynesian AD/AS diagram, that the economy may be in equilibrium at any level of real output where AD intersects AS.
  • Explain, using a diagram, that if the economy is in equilibrium at a level of real output below the full employment level of output, then there is a deflationary (recessionary) gap.
  • Discuss why, in contrast to the monetarist/new classical model, the economy can remain stuck in a deflationary (recessionary) gap in the Keynesian model.
  • Explain, using a diagram, that if AD increases in the vertical section of the AS curve, then there is an inflationary gap.
  • Discuss why, in contrast to the monetarist/new classical model, increases in aggregate demand in the Keynesian AD/AS model need not be inflationary, unless the economy is operating close to, or at, the level of full employment.

Task:  You will receive another packet to address these objectives and will be practicing drawing graphs and using them to explain long-run equilibrium positions.
​


0 Comments

2.2 Aggregate demand and aggregate supply (3) - long run aggregate supply

3/21/2016

0 Comments

 
Alternative views of aggregate supply - this is where there is controversy...
  • Explain, using a diagram, that the monetarist/new classical model of the long-run aggregate supply curve (LRAS) is vertical at the level of potential output (full employment output) because aggregate supply in the long run is independent of the price level.
  • Explain, using a diagram, that the Keynesian model of the aggregate supply curve has three sections because of “wage/price” downward inflexibility and different levels of spare capacity in the economy.
Shifting the aggregate supply curve over the long term
  • Explain, using the two models above, how factors leading to changes in the quantity and/or quality of factors of production (including improvements in efficiency, new technology, reductions in unemployment, and institutional changes) can shift the aggregate supply curve over the long term.

Once again you will be working from the Aggregate Supply packet to address the objectives above.


0 Comments

2.2 Aggregate demand and aggregate supply (2) - short run aggregate supply

3/21/2016

0 Comments

 
The meaning of aggregate supply - we will watch the video above and you will be given a handout to complete
  • Describe the term aggregate supply.
  • Explain, using a diagram, why the short-run aggregate supply curve (SRAS curve) is upward sloping.
  • Explain, using a diagram, how the AS curve in the short run (SRAS) can shift due to factors including changes in resource prices, changes in business taxes and subsidies and supply shocks.


0 Comments

2.2 Aggregate demand and aggregate supply (1) - aggregate demand 

3/10/2016

0 Comments

 
The AD curve
  • Distinguish between the microeconomic concept of demand for a product and the macroeconomic concept of aggregate demand.
  • Construct an aggregate demand curve.
  • Explain why the AD curve has a negative slope.
The components of AD
  • Describe consumption, investment, government spending and net exports as the components of aggregate demand.
The determinants of AD or causes of shifts in the AD curve
  • Explain how the AD curve can be shifted by changes in consumption due to factors including changes in consumer confidence, interest rates, wealth, personal income taxes (and hence disposable income) and level of household indebtedness.
  • Explain how the AD curve can be shifted by changes in investment due to factors including interest rates, business confidence, technology, business taxes and the level of corporate indebtedness.
  • Explain how the AD curve can be shifted by changes in government spending due to factors including political and economic priorities.
  • Explain how the AD curve can be shifted by changes in net exports due to factors including the income of trading partners, exchange rates and changes in the level of protectionism.

Aggregate demand is the total spending in an economy consisting of consumption, investment, government expenditure and net exports, i.e. the total quantity of output (Real GDP) that all buyers in an economy want to buy at different possible price levels (Average Price Level).  

You will be given some worksheets to do to address the objectives above, one of them linked to the video below:
0 Comments

    Archives

    September 2018
    August 2018
    June 2016
    May 2016
    April 2016
    March 2016
    February 2016
    January 2016
    November 2015
    October 2015
    September 2015
    August 2015
    January 2015
    December 2014
    November 2014
    October 2014
    September 2014
    August 2014

    Maree Spraggon

    Teacher of IB Economics at the American School of Budapest

    Categories

    All
    Equity

    RSS Feed

Powered by Create your own unique website with customizable templates.